
Lewisham's claimant count fell by 215 over the year to 14,715 in July, while the UK total rose. But the borough's under-25s went the other way, up 70.
The number of Lewisham residents claiming unemployment-related benefits fell over the past year, at a time when the UK total was rising. New figures published on 18 August put the borough’s claimant count at 14,715 in July 2026, down 215 on the 14,930 recorded in July 2025 (ONS Claimant Count via nomis).
That headline hides the more interesting movement. Split the total by age, and the fall belongs entirely to one group.
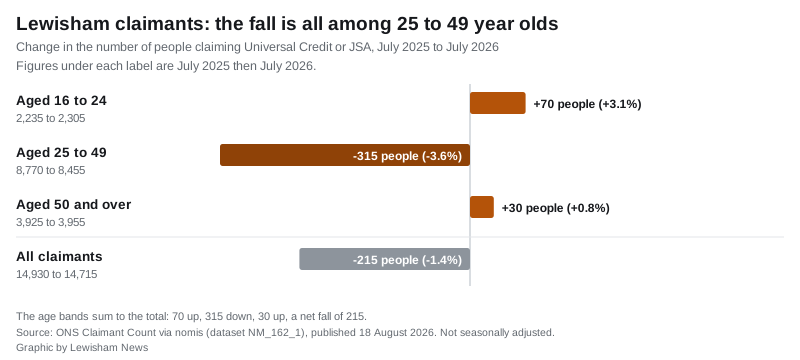
- Aged 16 to 24: up 70, from 2,235 to 2,305, a rise of 3.1%.
- Aged 25 to 49: down 315, from 8,770 to 8,455, a fall of 3.6%.
- Aged 50 and over: up 30, from 3,925 to 3,955, a rise of 0.8%.
The three bands sum to the borough’s net fall of 215. Older and younger residents are both slightly worse off than a year ago; only the large middle group improved.
Lewisham fell while the country rose
The direction of travel matters as much as the number. Over the same twelve months:
- The UK claimant count rose, from 1,668,595 to 1,690,970, up 1.3%. The UK rate went from 3.8% to 3.9% of residents aged 16 to 64.
- London fell, from 355,730 to 349,355, down 1.8%. The London rate eased from 5.7% to 5.6%.
- Lewisham fell by 1.4%, and its rate held at 6.8%.
So Lewisham tracked London rather than the country. All three figures come from the same nomis dataset, which is the only fair way to compare them.
Lewisham’s rate has barely moved all year. It has sat at 6.8% or within a tenth of a point of it every month since February 2026. The month-on-month picture is a small rise: June’s 14,625 became July’s 14,715, up 90.
Seventh highest in London
At 6.8%, Lewisham has the seventh highest claimant rate of London’s 33 local authorities in July 2026. Three boroughs share the top spot on 7.5%: Barking and Dagenham, Haringey and Newham. At the other end sit the City of London on 1.1% and Richmond upon Thames on 2.6%.
The gap with the neighbours is wide, and it is not new:
| Borough | July 2025 | July 2026 | Change |
|---|---|---|---|
| Lewisham | 14,930 | 14,715 | -1.4% |
| Lambeth | 15,080 | 15,065 | -0.1% |
| Southwark | 13,280 | 13,350 | +0.5% |
| Greenwich | 11,945 | 12,090 | +1.2% |
| Bromley | 7,325 | 7,320 | -0.1% |
Bromley, immediately south, has a claimant rate of 3.5%, roughly half Lewisham’s. Greenwich sits at 5.8% and Southwark at 5.6%, both below the borough.
What the claimant count actually measures
This is not an unemployment figure, and it is worth being precise about that. Nomis defines the claimant count as “the stock of Universal Credit and Job Seekers Allowance claimants”. That includes people who are working but on Universal Credit under a requirement to look for more or better paid work.
Two further caveats apply. The figures are not seasonally adjusted, so summer months are not directly comparable with winter ones, which is why the comparisons above are July against July. And the count reflects benefit rules as well as the job market: a change in who has to look for work changes the number without anyone’s job changing.
What it means for you
- If you are under 25 and out of work in Lewisham, the data says you are not an outlier. That group is the one getting larger here, against a falling borough total.
- Claiming Universal Credit is not the same as being unemployed. If you are in work on a low income, you may still be counted, and you may still be eligible.
- The borough’s rate has been flat at about 6.8% for six months. Anyone waiting for a sharp local recovery is not seeing one in this measure.
- These are borough-wide figures. They tell you nothing about Sydenham as against Deptford; ward-level claimant data is published separately.
- For the other half of the household-finances picture, our Lewisham council tax bands page sets out what each band costs this year.
Sources
- ONS Claimant Count via nomis, dataset NM_162_1, Lewisham 24-month series (borough totals and rates, dataset last updated 18 August 2026)
- Claimant count by age band, Lewisham, July 2025 and July 2026
- Claimant rate for all 33 London local authorities, July 2026
- Lewisham and neighbouring boroughs, July 2025 and July 2026
- Nomis dataset description for the Claimant Count (definition of what the count includes)
Figures are not seasonally adjusted. Lewisham News pulled them from the nomis API on 21 August 2026.
Have your say