
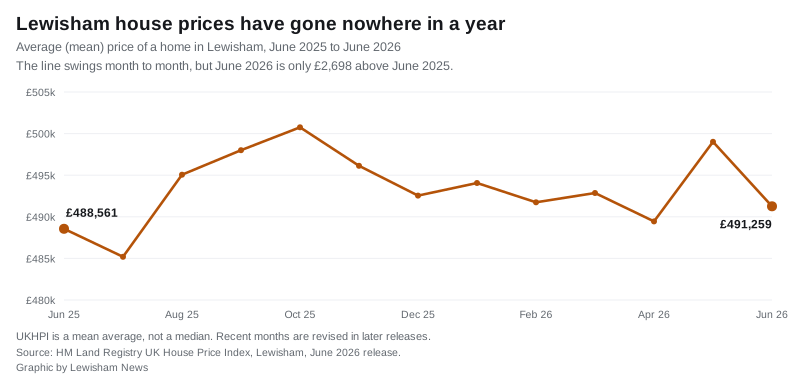
The average Lewisham home was worth £491,259 in June, just £2,698 more than a year earlier. Flats fell 0.8% over the year while terraces rose 2.3%.
The average Lewisham home was worth £491,259 in June 2026, according to the latest Land Registry UK House Price Index. That is 0.6% more than a year earlier, and 1.6% less than in May.
Put in pounds, the annual figure is smaller than it sounds. A year ago the borough average was £488,561. Twelve months of the market have added £2,698, less than a single month’s mortgage payment on many Lewisham homes.
Flats are worth less than a year ago
The borough-wide number hides a clear split by property type. Terraces and semis are rising; flats are going backwards.
| Property type | June 2026 average | Annual change |
|---|---|---|
| Detached | £1,118,334 | +0.5% |
| Semi-detached | £776,060 | +1.9% |
| Terraced | £603,258 | +2.3% |
| Flat or maisonette | £379,341 | -0.8% |
| All property types | £491,259 | +0.6% |
That matters more in Lewisham than it would in a leafier borough, because flats are a large share of what actually sells here. A Lewisham flat owner who bought a year ago is, on this measure, slightly down.
The index also gives a first-time buyer average of £433,891, up 0.3% over the year. On the same measure, an existing owner-occupier’s home averages £608,065.
Rising, while London falls
Lewisham’s modest gain looks better once you set it against the capital:
- London: £553,870, down 2.5% over the year.
- England: £293,262, up 1.8%.
- Lewisham: £491,259, up 0.6%.
So the borough is doing better than London as a whole and worse than England. Among the neighbours, only Southwark is growing faster.
| Borough | June 2026 average | Annual change |
|---|---|---|
| Southwark | £582,473 | +2.2% |
| Lewisham | £491,259 | +0.6% |
| Greenwich | £465,132 | -0.5% |
| Bromley | £518,235 | -1.4% |
| Lambeth | £548,034 | -3.3% |
Two things to know about this number
It is a mean, not a median. UKHPI averages the value of all homes, so a handful of large sales pull it upward. The typical Lewisham sale price is lower than £491,259. Anyone using this figure as a household budget should treat it as a market indicator rather than an asking price.
Recent months get revised. When May’s figures first appeared, the borough average was published as £496,774, an annual rise of 2.3%. In this release, May has been revised up to £499,014 and 2.7%. Land Registry restates recent months as more completed sales are registered, so the newest month in any release is the least settled. June’s £491,259 will move too.
That volatility is visible in the chart above. Over the past thirteen months the annual change has been reported as high as 4.2% and as low as minus 0.9%. The steadier reading is the one the two endpoints give: broadly flat.
What it means for you
- Selling a flat? The index says the market has not been on your side this year. Price against recent comparable sales on your street, not against the borough headline.
- Selling a terrace or semi? These are the types with real annual growth, at 2.3% and 1.9%.
- Buying? Lewisham remains around £62,000 below the London average and about £27,000 below Bromley, while rising slightly where both are falling.
- Do not read one month as a trend. June’s 1.6% monthly fall follows a 2.0% monthly rise in May. Both will be revised.
- Our Lewisham house prices page sets out prices by area and how the borough splits, and council tax bands covers the annual bill that comes with the purchase.
Sources
- HM Land Registry UK House Price Index, Lewisham, June 2026 (borough average, property types, first-time buyer average, annual and monthly change)
- UK House Price Index, Lewisham, May 2026, as revised (£499,014, revised up from the £496,774 first published)
- UK House Price Index, Lewisham, June 2025 (£488,561, the year-earlier comparison)
- UK House Price Index, London, June 2026 and England, June 2026
- Neighbouring boroughs, June 2026: Southwark, Greenwich, Bromley, Lambeth
- Browse the Lewisham index yourself
Lewisham News pulled these figures from the Land Registry UKHPI API on 21 August 2026. UKHPI is a mean average and recent months are subject to revision.
Have your say