
14,610 people in Lewisham claimed unemployment-related benefits in August, a 6.8% rate against London's 5.5%. Over-50s are the only age group rising.
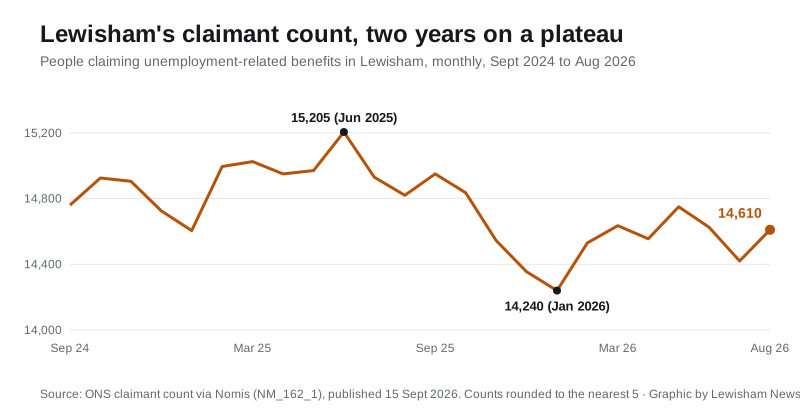
Some 14,610 people in Lewisham were claiming benefits principally because they are out of work in August 2026, according to figures published by the Office for National Statistics on 15 September.
That is 6.8% of the borough’s residents aged 16 to 64. Only six of London’s 33 boroughs have a higher rate: Barking and Dagenham, Haringey and Newham at 7.4%, Brent and Enfield at 7.2%, and Hackney at 6.9%. London as a whole is at 5.5% and the UK at 3.9%.
The count rose by 190 on July but is 210 lower than in August 2025, when the rate was 6.9%.
A two-year plateau
The chart is striking for how little it moves. Over 24 months the count has stayed between 14,240 (January 2026) and 15,205 (June 2025), a band of under a thousand people in a borough of around 300,000 residents. Whatever the national labour market has done, Lewisham’s claimant count has neither surged nor meaningfully fallen.
Over-50s are the one group rising
The age breakdown shows where the small year-on-year fall came from, and who it missed:
| Age group | August 2026 | August 2025 | Change |
|---|---|---|---|
| 16 to 24 | 2,310 | 2,315 | -5 |
| 25 to 49 | 8,380 | 8,630 | -250 |
| 50 and over | 3,920 | 3,870 | +50 |
The whole improvement sits in the 25 to 49 group. Claimants aged 50 and over have risen, and they now make up more than a quarter of the borough’s total. Men outnumber women on the count, 7,780 to 6,835.
Higher than every neighbour
Lewisham’s 6.8% is the highest claimant rate in its corner of London. Every bordering borough is lower:
| Borough | August 2026 rate |
|---|---|
| Lewisham | 6.8% |
| Lambeth | 6.2% |
| Greenwich | 5.8% |
| Southwark | 5.6% |
| Bromley | 3.5% |
The gap with Bromley, one boundary road away in places like Downham, is nearly double the rate. That contrast is a long-standing feature of south east London rather than something new in this release, but it is worth holding alongside the housing figures: Lewisham’s house prices are currently outperforming all four of those neighbours while its claimant rate exceeds them.
What this number is, and is not
The claimant count is not the unemployment rate. The ONS says plainly that it “does not attempt to measure unemployment”, which is a separate concept defined by the International Labour Organisation. It measures “the number of people claiming benefits principally for the reason of being unemployed”, drawn from the benefits system. Under Universal Credit that includes some people who are in work on low earnings but required to look for more. Counts are rounded to the nearest five.
What it means for you
- If you are one of the 14,610, Lewisham Council runs a free employment support service, Lewisham Works, alongside Jobcentre Plus.
- The next monthly release is due on 20 October 2026, covering September. We report these figures when they are published.
- For the wider local economy picture, the Lewisham house prices page has the longer view of the borough’s housing market.
Sources
- ONS claimant count for Lewisham, August 2026, via Nomis (24-month series of counts)
- Claimant rate for all 33 London boroughs, August 2026 (the ranking; London region and UK rates from the same dataset)
- Age breakdown for Lewisham (age codes 2, 3 and 4; sex split from gender codes 1 and 2)
- ONS Claimant Count QMI (what the count does and does not measure)
Lewisham News pulled these figures from the Nomis API (dataset NM_162_1, last updated 15 September 2026) on 20 September 2026.
Have your say