
The average Lewisham home was £488,658 in July, up 0.7% in a year while London fell 3.3% and Lambeth 6.3%. Flats are the borough's only type losing value.
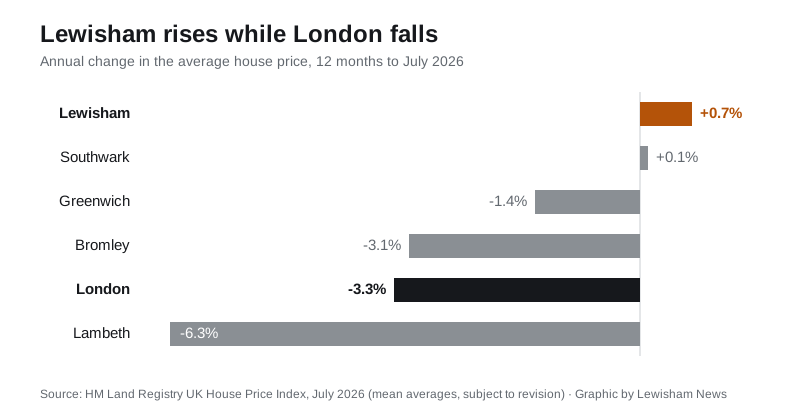
The average Lewisham home was worth £488,658 in July 2026, up 0.7% on a year earlier, according to the latest Land Registry UK House Price Index. That gain of £3,434 sounds unremarkable until you look over the borough boundary.
London as a whole fell 3.3% over the same twelve months. Lambeth fell 6.3%, Bromley 3.1% and Greenwich 1.4%. Of Lewisham’s neighbours only Southwark also avoided a fall, and barely, at 0.1%. On this release, Lewisham is the strongest housing market in south east London.
| Area | July 2026 average | Annual change |
|---|---|---|
| Lewisham | £488,658 | +0.7% |
| Southwark | £572,478 | +0.1% |
| Greenwich | £462,589 | -1.4% |
| Bromley | £511,670 | -3.1% |
| Lambeth | £536,623 | -6.3% |
| London | £550,037 | -3.3% |
For context, the England average is £293,479, up 1.1% over the year.
Flats are still the exception
Houses of every kind rose over the year. Flats did not, for the second monthly release in a row.
| Property type | July 2026 average | Annual change |
|---|---|---|
| Detached | £1,116,536 | +2.4% |
| Semi-detached | £773,685 | +2.7% |
| Terraced | £602,116 | +2.7% |
| Flat or maisonette | £376,322 | -0.9% |
| All property types | £488,658 | +0.7% |
A Lewisham flat averages £376,322, down £3,527 on July 2025. Even that is a mild result by London standards: flats across the capital are down 6.6% over the year, and Lambeth’s are down 7.0%. The index puts the first-time buyer average at £431,343, up 0.4%.
The June number has already been revised down
When we reported the June figures, the borough average was published as £491,259. This release restates June as £489,950. Land Registry revises recent months as more completed sales are registered, so July’s £488,658 will move too, and monthly wobbles matter less than the twelve-month picture.
Two more things to keep in mind when using these numbers:
- UKHPI is a mean average, not a median. A handful of expensive sales pull it up, so the typical Lewisham sale completes below £488,658.
- The monthly path is jumpy. July was down 0.3% on June, which was itself down 2.1% on a strong May. The annual comparison is the steadier read.
What it means for you
- Selling a house? Terraces and semis are the borough’s strongest performers at 2.7% annual growth, and the market around you is rising while most of London falls.
- Selling a flat? The index has flats slightly down on a year ago. Price against recent sales on your own street rather than the borough headline.
- Buying? Lewisham remains about £61,000 below the London average, and cheaper than Southwark, Lambeth and Bromley, while holding its value better than any of them.
- Our Lewisham house prices page breaks the borough down by area, and council tax bands covers the bill that comes with a purchase.
Sources
- HM Land Registry UK House Price Index, Lewisham, July 2026 (borough average, property types, first-time buyer average, annual and monthly change)
- UK House Price Index, Lewisham, July 2025 (£485,224 and flat average £379,849, the year-earlier comparisons)
- UK House Price Index, Lewisham, June 2026, as revised (£489,950, revised down from the £491,259 first published)
- July 2026 comparators: Southwark, Greenwich, Bromley, Lambeth, London, England
- Browse the Lewisham index yourself
Lewisham News pulled these figures from the Land Registry UKHPI API on 20 September 2026. UKHPI is a mean average and recent months are subject to revision.
Have your say