
The average Lewisham home was £486,416 in August, down 1.6% in a year and the first annual fall since April. Flats fell 3.1% while houses held level.
The average Lewisham home was worth £486,416 in August 2026, down 1.6% on a year earlier, according to the Land Registry UK House Price Index published this week. That is £8,099 less than in August 2025.
It is the borough’s first annual fall since April. A month ago, on the July figures, Lewisham was the strongest housing market in south east London. This release puts it in line with its neighbours, all of which are now falling.
Flats fell, houses held level
| Property type | August 2026 average | Annual change |
|---|---|---|
| Detached | £1,106,429 | 0.0% |
| Semi-detached | £768,448 | 0.0% |
| Terraced | £600,670 | +0.1% |
| Flat or maisonette | £374,267 | -3.1% |
| All property types | £486,416 | -1.6% |
The whole fall comes from flats. A Lewisham flat averages £374,267, down £11,811 on August 2025. Houses of every kind are within a fraction of a percent of where they were a year ago.
The index puts the first-time buyer average at £429,182, down 2.0% over the year.
How the neighbours compare
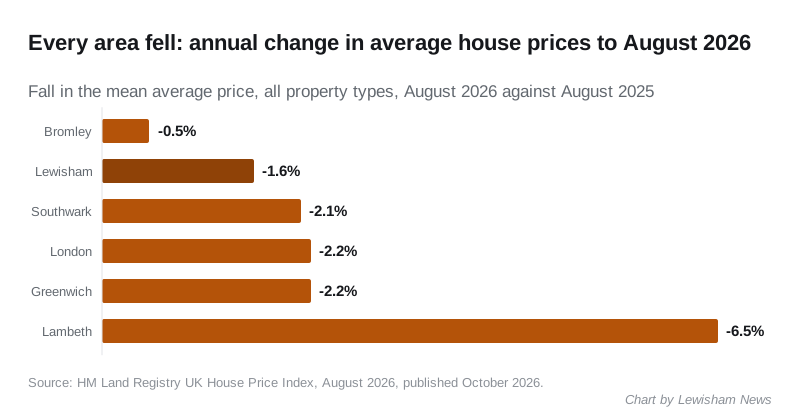
Every area around Lewisham fell over the year. Bromley fell least, and has taken over from Lewisham as the steadiest market in this corner of London.
| Area | August 2026 average | Annual change |
|---|---|---|
| Bromley | £520,253 | -0.5% |
| Lewisham | £486,416 | -1.6% |
| Southwark | £569,160 | -2.1% |
| Greenwich | £462,868 | -2.2% |
| Lambeth | £540,198 | -6.5% |
| London | £554,430 | -2.2% |
Lewisham still does better than London as a whole. Flats tell the same story: London’s are down 5.0% over the year, Greenwich’s 3.9% and Lambeth’s 7.2%. The England average is £293,525, up 0.4%.
Why August looks weak
Part of the fall is about last year, not this one. In August 2025 the Lewisham average jumped 1.9% in a single month, to £494,515. Comparing against that peak makes this August look worse than the month-on-month move, which was a fall of 0.3%.
The figures also keep moving after publication:
- We reported July at £488,658, up 0.7%. This release restates July as £487,714, up 0.5%.
- UKHPI is a mean average, not a median. A few expensive sales pull it up, so the typical Lewisham sale completes below £486,416.
- The annual change has already dipped below zero this year, in March and April, before recovering in May. One month’s figure is not a trend.
What it means for you
- Selling a flat? Flats are where prices are falling, down 3.1% in Lewisham and 5.0% across London. Price against recent sales in your own building or street.
- Selling a house? Terraces, semis and detached homes are flat on the year. The borough headline undersells them.
- Buying? The average Lewisham home is about £68,000 below the London average, and first-time buyers are paying 2.0% less than a year ago.
- Our Lewisham house prices page breaks the borough down by area, and council tax bands covers the bill that comes with a purchase.
Sources
- HM Land Registry UK House Price Index, Lewisham, August 2026 (borough average, property types, first-time buyer average, annual and monthly change)
- UK House Price Index, Lewisham, August 2025 (£494,515, the 1.9% monthly rise, and the flat average of £386,078)
- UK House Price Index, Lewisham, July 2026, as revised (£487,714, up 0.5%)
- Earlier 2026 annual changes: March, April, May
- August 2026 comparators: Bromley, Southwark, Greenwich, Lambeth, London, England
- Browse the Lewisham index yourself
Lewisham News pulled these figures from the Land Registry UKHPI API on 23 October 2026. UKHPI is a mean average and recent months are subject to revision.
Have your say